
SPRING 2021, THE EVIDENCE FORUM, WHITE PAPER
 Margaret Richards, PhD, MPH Senior Research Leader Real-World Evidence Evidera, a PPD business |
Introduction
2000 was the Year of the Rat, SARS-CoV-2, and the Epidemiologist. Some of these epidemiologists have university degrees; many got their training through social media and earnest research. Those of us in the business often share stories of mothers who once proclaimed our jobs “a mystery” but now hold forth on subjects like vaccine efficacy and herd immunity.
There’s a fourth – and dare we say sizable – category of credentialed epidemiologists who are revisiting the classic concepts of our discipline, long filed away because we were focused on cancer, neurodegenerative diseases, age-related macular degeneration, and so on. Nothing like a pandemic to bring us all back into the classroom of Infectious Diseases 101. In that spirit, what follows is a brief primer on pandemic-related topics.
Endemic, Epidemic, or Pandemic:
It’s a Matter of Location
You may have heard these terms at one time or another: endemic, epidemic, pandemic. As you move alphabetically through them, they increase in scale and scope.
Endemic derives from the Greek endēmios (native) based on dēmos (people). An endemic is an illness that belongs to a specific location or group, and endemics are a constant presence in these locations. Malaria is endemic to parts of Africa and dengue fever is endemic to certain regions of Africa, Central and South America, and the Caribbean.1
Epidemic derives from the Greek epi (upon) and dēmos (the people). An epidemic affects a larger than expected number of persons within a community, population, or region in a specified period of time. When COVID-19 was limited to Wuhan, China, it was an epidemic. Once it started to spread globally, it became a pandemic. As you contemplate the term epidemic, you can visualize how to break down epidemiology (and epidemiologist). The official definition of epidemiology is “the study of the distribution and determinants of health-related states or events in specified populations, and the application of this study to the control of health problems.”2 But if that’s a mouthful, at your next dinner party or lunch with your mom, you can simply say: “Epidemiology is the study of epidemics, and I study epidemics.”
A pandemic is an epidemic that is spread over multiple countries or continents. A pandemic is an epidemic with a passport. Pan is the Greek prefix signifying all or everything. It has been said that pandemics occur every 100 years or so, and that we were long overdue for COVID-19. History does not quite support a 100-year cycle, however. Table 1 offers a look at some of the most significant epidemics and pandemics of the last 700 years.
Table 1. A Time-Lapse of Selected Epidemics and Pandemics: The Last ~700 years3,4,5,6

Figure 1. The Plague Doctor’s Outfit7
The clothing worn by plague doctors was intended to protect them from airborne diseases (miasma) during outbreaks of the Bubonic Plague in Europe. It is seen as a symbol of disease and/or death.
The typical costume consisted of an ankle-length overcoat and a bird-like beak mask which was filled with purported medicinal, sweet, or strong-smelling substances (e.g., dried flowers, lavender, juniper berry, cloves), along with gloves, boots, and a wide-brimmed hat.
The wide-brimmed leather hat indicated their medical profession. The doctors used wooden canes to point out areas needing attention and to examine patients without touching them.
R0 and R:
Measuring Transmissibility
R0, pronounced R naught, is the basic reproduction number (rate) and refers to the contagiousness and transmissibility of infectious disease pathogens. R0 is an estimate of the speed at which an infectious disease currently (it can change) spreads through a given population. Simply put, it is the number of people, on average, one person can infect. These unlucky recipients are called secondary cases.
Typically, R0 is <1 if the disease is controlled or not spreading. If R0 >1, the disease can spread (perhaps exponentially, depending on value) to a wider population, potentially creating an epidemic or pandemic. The R naughtiest (see what we did there?) pathogen is measles, because one person with measles can infect 12-18 secondary cases.9
R0 is normally calculated based on duration of contagiousness, the likelihood of transmission between the infected and susceptible individual, and contact rate. R0 is further impacted by geo-environmental factors, public health policies and enforcement (mask-wearing, quarantining, physical distancing), and the presence of immunity (via illness or vaccination). R0 applies only to a population in which everyone is vulnerable.
That’s where the effective reproductive number, or R, comes in. Rarely will a population be totally vulnerable to infection, as is assumed by R0. Some contacts will be immune due to prior infection or immunization. Therefore, not all contacts will become infected and the average number of secondary cases per infectious case will be lower than R0. R is the average number of secondary cases per infectious case in a population made up of both susceptible and non-susceptible hosts. If R>1, the number of cases will increase. If R=1, the disease is endemic, and if R<1 the number of cases will decline.
R is estimated as the product of R0 and the fraction or percent of the host population that is susceptible (x). The equation is: R = R0(x). For example, if R0 for COVID-19 is 4 and 75% of the population of interest is immune, the R for COVID-19 in that population is 4 x 0.25 = 1. Under these circumstances, a single case of COVID-19 would produce an average of one secondary case. To successfully eliminate a disease from a population, R must be < 1. See Table 2 for more information about R0 and selected infectious diseases.
Table 2. R0 for Selected Diseases
Modeling Infection:
The Compartment’s the Thing
Kermack and McKendrick, wishing to explain the rapid rise and fall in the number of infected patients observed in epidemics such as the plague in London from 1665-1666 and cholera in London in 1865, developed mathematical models for disease spread.10 These compartmental models employ mathematical modeling of infectious diseases to try to predict how a disease spreads, the total number infected, or the duration of an epidemic. The population in question is assigned to compartments with labels such as Susceptible (S), Infectious (I), or Recovered/Removed (R) (SIR model) and individuals progress between compartments11 (See Figure 2). There are many types of models in addition to SIR. They include SEIR, SPQEIR, and MSIR wherein E=Exposed, P=Protected, Q=Quarantined, and M=Maternal Immunity.
The models estimate various epidemiological parameters such as R0. Models can show how different public health interventions affect the outcome of the epidemic. These include how mask-wearing or physical distancing may alter the course of transmission, how vaccines will impact the pandemic, and what we can expect from viral mutations or variants.
One of the most practical uses of any compartmental model is to monitor R0, R, and the number of cases predicted in the coming weeks or months. Sponsors want to know where to target clinical trials or studies and public health officials need to be prepared for the potential onslaught of cases that will stress various parts of the healthcare system. Although these models are far from perfect, they can be an important tool to aid in epidemic or pandemic planning and response.
Figure 2. A Typical SIR Model12
Everything Vaccine:
Efficacy, Effectiveness, Etc.
Vaccine efficacy is the percent reduction in disease occurrence in a vaccinated group compared to an unvaccinated group under optimal conditions (i.e., a randomized controlled trial). When we look at efficacy, we are asking “Does the vaccine work?” Vaccine effectiveness assesses the ability of a vaccine to prevent outcomes of interest in the real world. When we look at effectiveness, we are asking “Does the vaccine help people?”
The basic formula for vaccine efficacy is written as:

where VE=vaccine efficacy, ARU=attack rate among unvaccinated, and ARV=attack rate among vaccinated persons. Attack rate refers to the percentage of an at-risk population that contracts the disease of interest – however disease is defined – during a specified period. To calculate the relative risk (RR) of developing the disease for vaccinated people compared to unvaccinated people, the equation is VE=1-RR x 100%. This is a classic cohort design: we assemble two groups of people with different exposures (vaccination) and watch for the development of disease (e.g., COVID-19).
Vaccine effectiveness, on the other hand, is typically estimated as 1 minus the Odds Ratio, or 1-OR x 100%. We start with a disease (COVID-19) and look back at exposure (vaccine); this is a classic case-control design. Case-control studies cannot establish causation because the lack of randomization means that we must be wary about misclassification, confounding, and other biases. The most we can say in case-control designs is that there is an association between outcome and exposure. In the past few decades, the test-negative design (TND) has come into vogue for measuring vaccine effectiveness.13 TND is a variation of the case-control design in which all participants meet a pre-specified, syndromic case definition, such as cough or shortness of breath plus one other COVID symptom, and a diagnostic assay is used to differentiate cases from controls. The TND offers two advantages: it is less burdensome because controls can be assembled while identifying cases, and it reduces bias and confounding due to similar healthcare use patterns between cases and controls.
Many locations around the US are standing up vaccination sites in empty stadiums with multiple lanes for drive-up injection.
While the pandemic continues, this is a very safe and efficient means of immunizing many people at once.
Figure 3. Delivering the Vaccine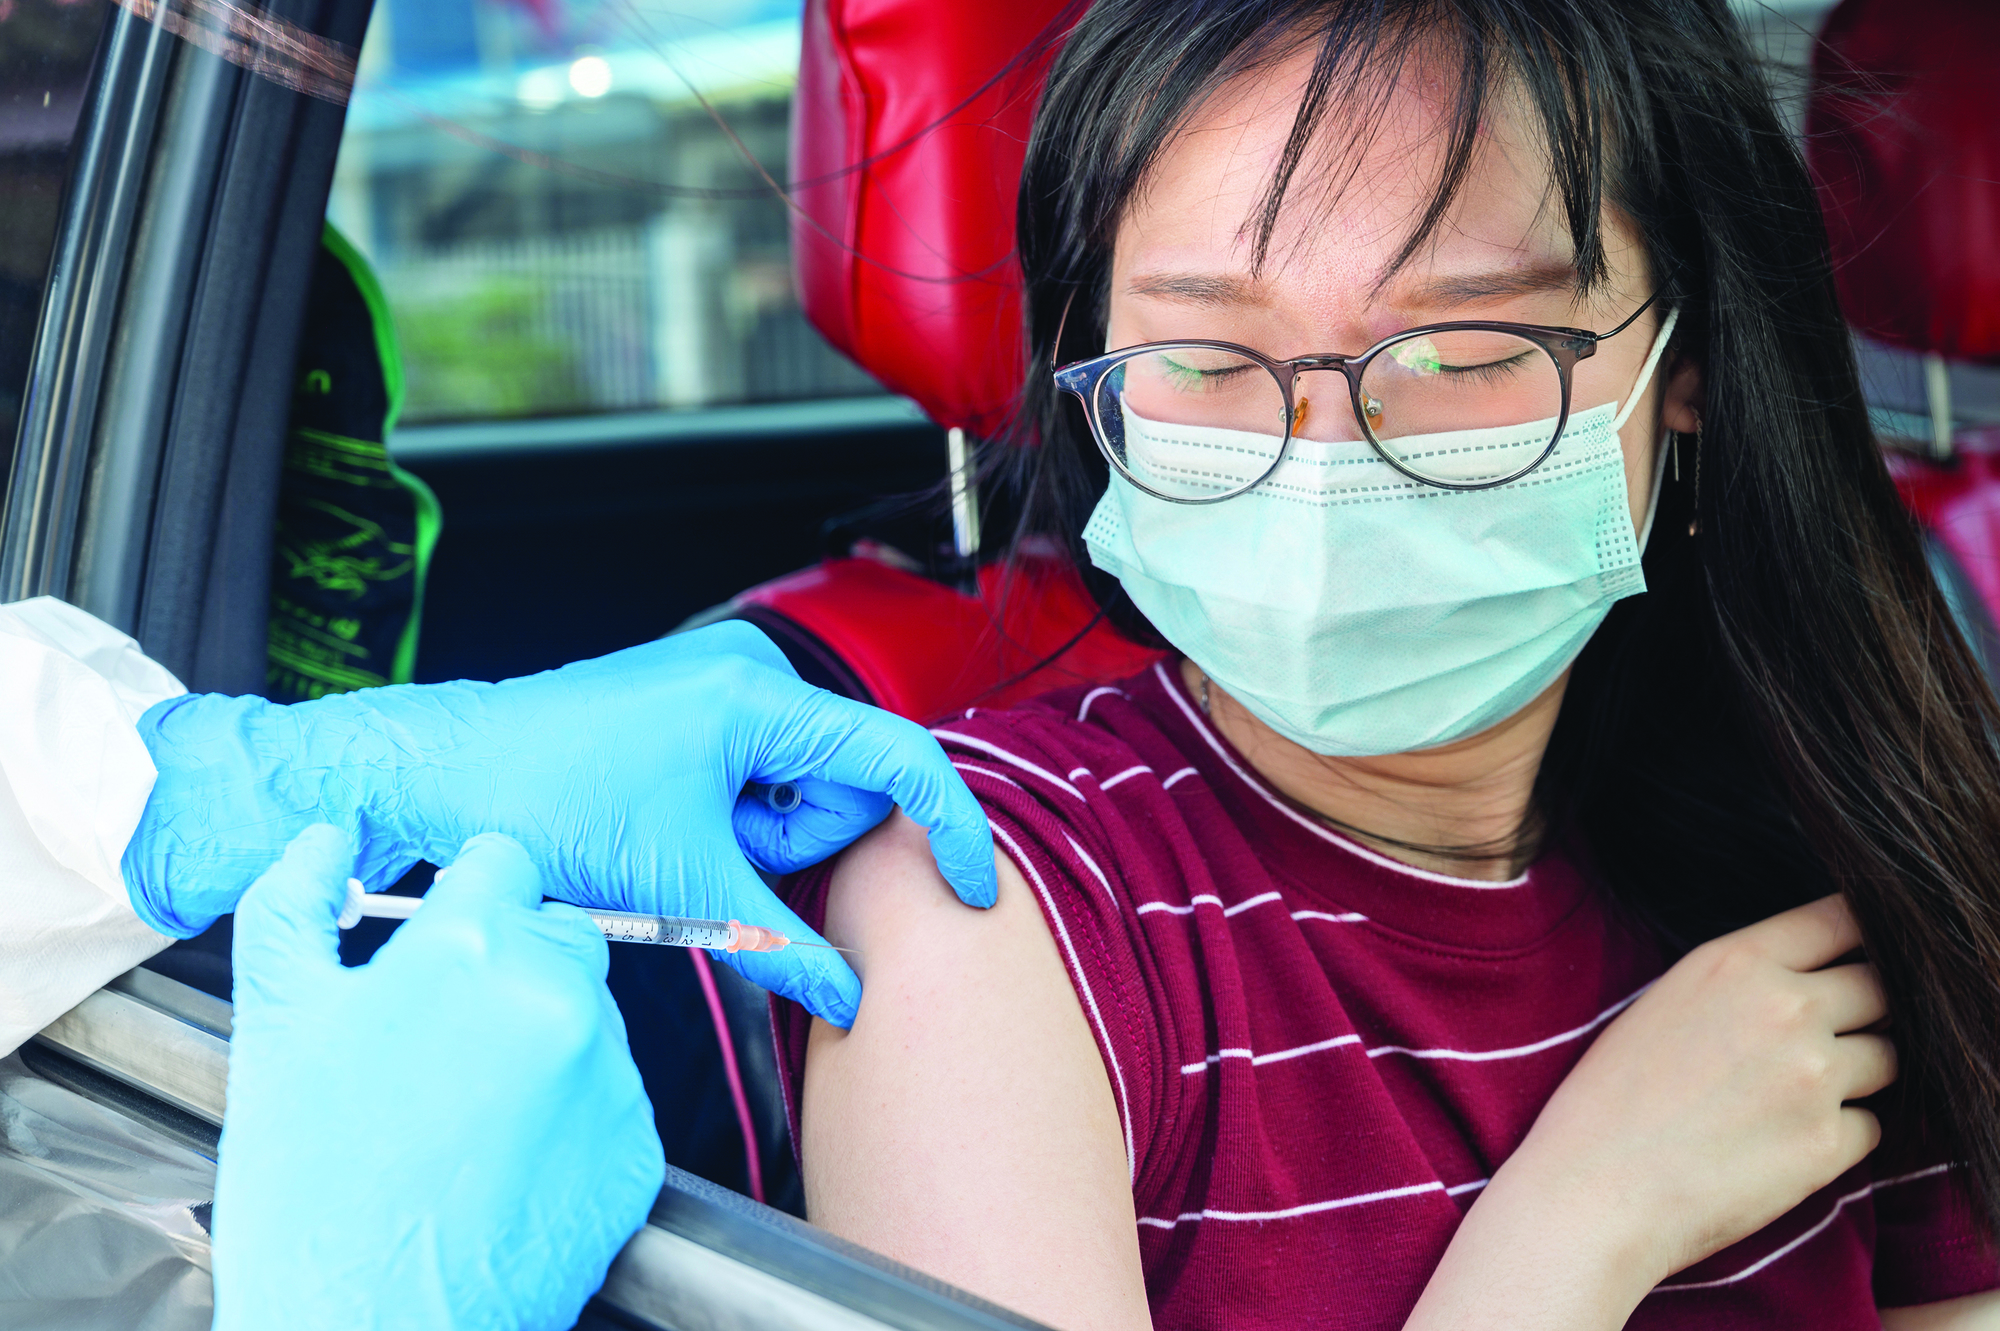
COVID-19 Vaccines
Much has been written about the efficacy of the first batch of COVID-19 vaccines granted Emergency Use Authorization. There has also been some anxiety over the safety of vaccines that seem to have been developed in months rather than years. Thus far, serious adverse events appear to be rare and it’s important to note that some of these new platforms have been in development for many years.
The Pfizer-BioNTech and Moderna vaccines reported stunning overall efficacies (> 90%) whereas Johnson & Johnson and Oxford-AstraZeneca had somewhat lower efficacy (65%-70%). For context, influenza vaccines, in any given year, are 20-60% effective in preventing flu onset. Recently, the Mayor of Detroit declined an allotment of the Johnson & Johnson vaccine, indicating that he would hold out for “better vaccines” for his city.14,15 Others are adamant that all vaccines are equal in preventing hospitalization and death and advise that, “the best vaccine is the one you get.”
Although the latter is undoubtedly, unequivocally true, these vaccines are not created equal. They are all important tools in our COVID-19 toolbox, but some are more effective at preventing symptoms whereas others are more effective at preventing severe outcomes. Their collective Phase 3 trials were not conducted in the same way, in the same locations, at the same time, or with the same outcomes assessed. Some vaccines require two doses compared to one dose; some have cold-storage requirements vs. regular refrigeration; and some expire quickly once thawed whereas others have a longer shelf-life. Bottom line: the world needs all available vaccines because vaccinating a large percentage of the population will move us closer to herd (or hive) immunity.
Herd (or Hive) Immunity:
How and When
The phrase “herd immunity” first appeared circa 1910 in the work of American livestock veterinarians concerned about contagious abortion (i.e., epidemics of spontaneous miscarriage) in cattle and sheep.16 Herd immunity occurs when a significant proportion of the population (the herd) has been vaccinated, or are immune due to previous infection, resulting in protection for susceptible individuals. The more individuals who are immune, the lower the likelihood that a susceptible person will encounter the infection. It is more difficult for diseases to spread when the chain of infection is slowed or interrupted.17
The herd immunity threshold is the proportion of a population that must be immune (to any degree, as there are gradations of immunity) for an infectious disease to become stable. When stability is reached, each case leads to, at most, a single new case (R <=1) and the infection stabilizes within the population. If the threshold for herd immunity is surpassed, then R<1 and the number of cases of infection decreases (See Figure 4).
Figure 4. What Does Herd (Hive) Immunity Look Like?19
Often, herd immunity is quoted to be around 80%, but it depends on both R0 and R. For COVID-19, we don’t yet know what herd immunity will look like, where that threshold may lie, and if it will involve lifetime or seasonal immunity. The classically trained epidemiologist will point out that we cannot know what the herd immunity level will be until the outbreak has passed. While the outbreak is ongoing, we can make only educated guesses.
Social scientists suggest that we use the phrase hive immunity rather than herd immunity since a herd connotes mindless queuing and a sacrificial march to the slaughterhouse whereas a hive connotes intelligent cooperation and planned activity.18
COVID-19:
Love it a Little
In the 1991 movie Backdraft, Captain Donald Rimgale (played by Robert DeNiro) tells trainee Brian Caffrey (played by William Baldwin) that fire, “… is a living thing, Brian. The only way to beat it is to think like it. Some guys on this job, the fire owns them, makes ‘em fight it on its level, but the only way to truly kill it is to love it a little.”
Fast forward to 2020. Virologists, social scientists, and epidemiologists suggest that using words or phrases such as war, lockdown, and warp speed militarize and distance us from the virus. Instead, we need to view COVID-19 as teaching us its viral mysteries. We must be students of the virus and its transmission, either as new recruits or as veterans revisiting our discipline. We must be willing to turn on a dime and pivot as needed to understand this clever bit of genetic material in all its cunning and elusive adaptation. We can fear and loathe COVID-19, but the only way to quell this pandemic is to get intellectually close to the virus; to respect it and maybe even love it a little.
The author wishes to acknowledge Dr. Edmond Malka, dually and classically trained epidemiologist and biostatistician par excellence, for his thoughtful review and commentary on this article.
References
- Intermountain Healthcare. What’s the Difference Between a Pandemic, an Epidemic, Endemic, and an Outbreak? Available at: https://intermountainhealthcare.org/blogs/topics/live-well/2020/04/whats-the-difference-between-a-pandemic-an-epidemic-endemic-and-an-outbreak/. Accessed March 18, 2021.
- Centers for Disease Control and Prevention. Lesson 1: Introduction to Epidemiology. Available at: https://www.cdc.gov/csels/dsepd/ss1978/lesson1/section1.html. Accessed March 18, 2021.
- Visual Capitalist. Visualizing the History of Pandemics. Available at: https://www.visualcapitalist.com/history-of-pandemics-deadliest/. Accessed March 18, 2021.
- Live Science. 20 of the Worst Epidemics and Pandemics in History. Available at: https://www.livescience.com/worst-epidemics-and-pandemics-in-history.html. Accessed March 18, 2021.
- BBC Culture. The Dark Side of Nursery Rhymes. Available at: https://www.bbc.com/culture/article/20150610-the-dark-side-of-nursery-rhymes. Accessed March 18, 2021.
- History. Did Colonists Give Infected Blankets to Native Americans as Biological Warfare? Available at: https://www.history.com/news/colonists-native-americans-smallpox-blankets. Accessed March 18, 2021.
- Wikipedia Contributors. (2021, April 7). Plague Doctor Costume. In Wikipedia, The Free Encyclopedia. Retrieved 20:44, April 16, 2021, from https://en.wikipedia.org/w/index.php?title=Plague_doctor_costume&oldid=1016491851.
- Johns Hopkins University & Medicine. Mortality Analyses. Available at: https://coronavirus.jhu.edu/data/mortality. Accessed March 18, 2021.
- Delamater PL, Street EJ, Leslie TF et al. Complexity of the Basic Reproduction Number (R0). Emerg Infect Dis. 2019 Jan;25(1):1-4. doi:10.3201/eid2501.171901.
- Columbia University Department of Statistics. 1 Introduction to Epidemic Modelling. Available at: http://www.stat.columbia.edu/~regina/research/notes123.pdf. Accessed March 18, 2021.
- Wikipedia. Compartmental Models in Epidemiology. Available at: https://en.wikipedia.org/wiki/Compartmental_models_in_epidemiology. Accessed March 18, 2021.
- KX. Dynamic Modeling of Covid-19. Available at: https://kx.com/blog/dynamic-modeling-of-covid-19/. Accessed March 18, 2021.
- Patel MM, Jackson ML, Ferdinands J. Postlicensure Evaluation of COVID-19 Vaccines. JAMA. 2020 Oct 16. doi: 10.1001/jama.2020.19328. Online ahead of print.
- CNN Health. Detroit Mayor Declines Johnson & Johnson Allotment, Saying the Other Vaccines are Better. Available at: https://www.cnn.com/2021/03/04/health/detroit-mayor-johnson-and-johnson-vaccine/index.html. Accessed March 18, 2021.
- Fortune. What Most People Get Wrong About Vaccine Efficacy Numbers. Available at: https://fortune.com/2021/03/05/covid-vaccine-efficacy-numbers-johnson-johnson/. Accessed March 18, 2021.
- Johns Hopkins Bloomberg School of Public Health. What is Herd Immunity and How Can We Achieve It With COVID-19? Available at: https://www.jhsph.edu/covid-19/articles/achieving-herd-immunity-with-covid19.html. Accessed March 18, 2021.
- Jones D, Helmreich S. A History of Herd Immunity. Lancet. 2020 Sep 19;396(10254):810-811. doi: 10.1016/S0140-6736(20)31924-3.
- Axios. Fischer S. The Words That Actually Persuade People on the Pandemic. Available at: https://www.axios.com/pandemic-language-study-covid-19-lockdown-d6ea2080-11fb-486f-b295-164b510c86e7.html%2002Mar2021. Accessed March 18, 2021.
- U.S. Government Accountability Office. Science & Tech Spotlight: Herd Immunity For COVID-19. Available at: https://www.gao.gov/products/gao-20-646sp. Accessed March 18, 2021.

